Monitor billing and usage
Monitor billing and usage metrics for your account and projects from the console or API
Neon exposes usage metrics in the Neon Console and through the Neon API. These metrics can answer questions like:
- What's my current bill?
- How much storage am I using?
- How many compute hours have I used?
- How many projects do I have?
- How many branches do I have?
View usage metrics in the Neon Console
Usage metrics in the console can be found on the Billing page, the Project Dashboard, and the Branches page.
Billing page
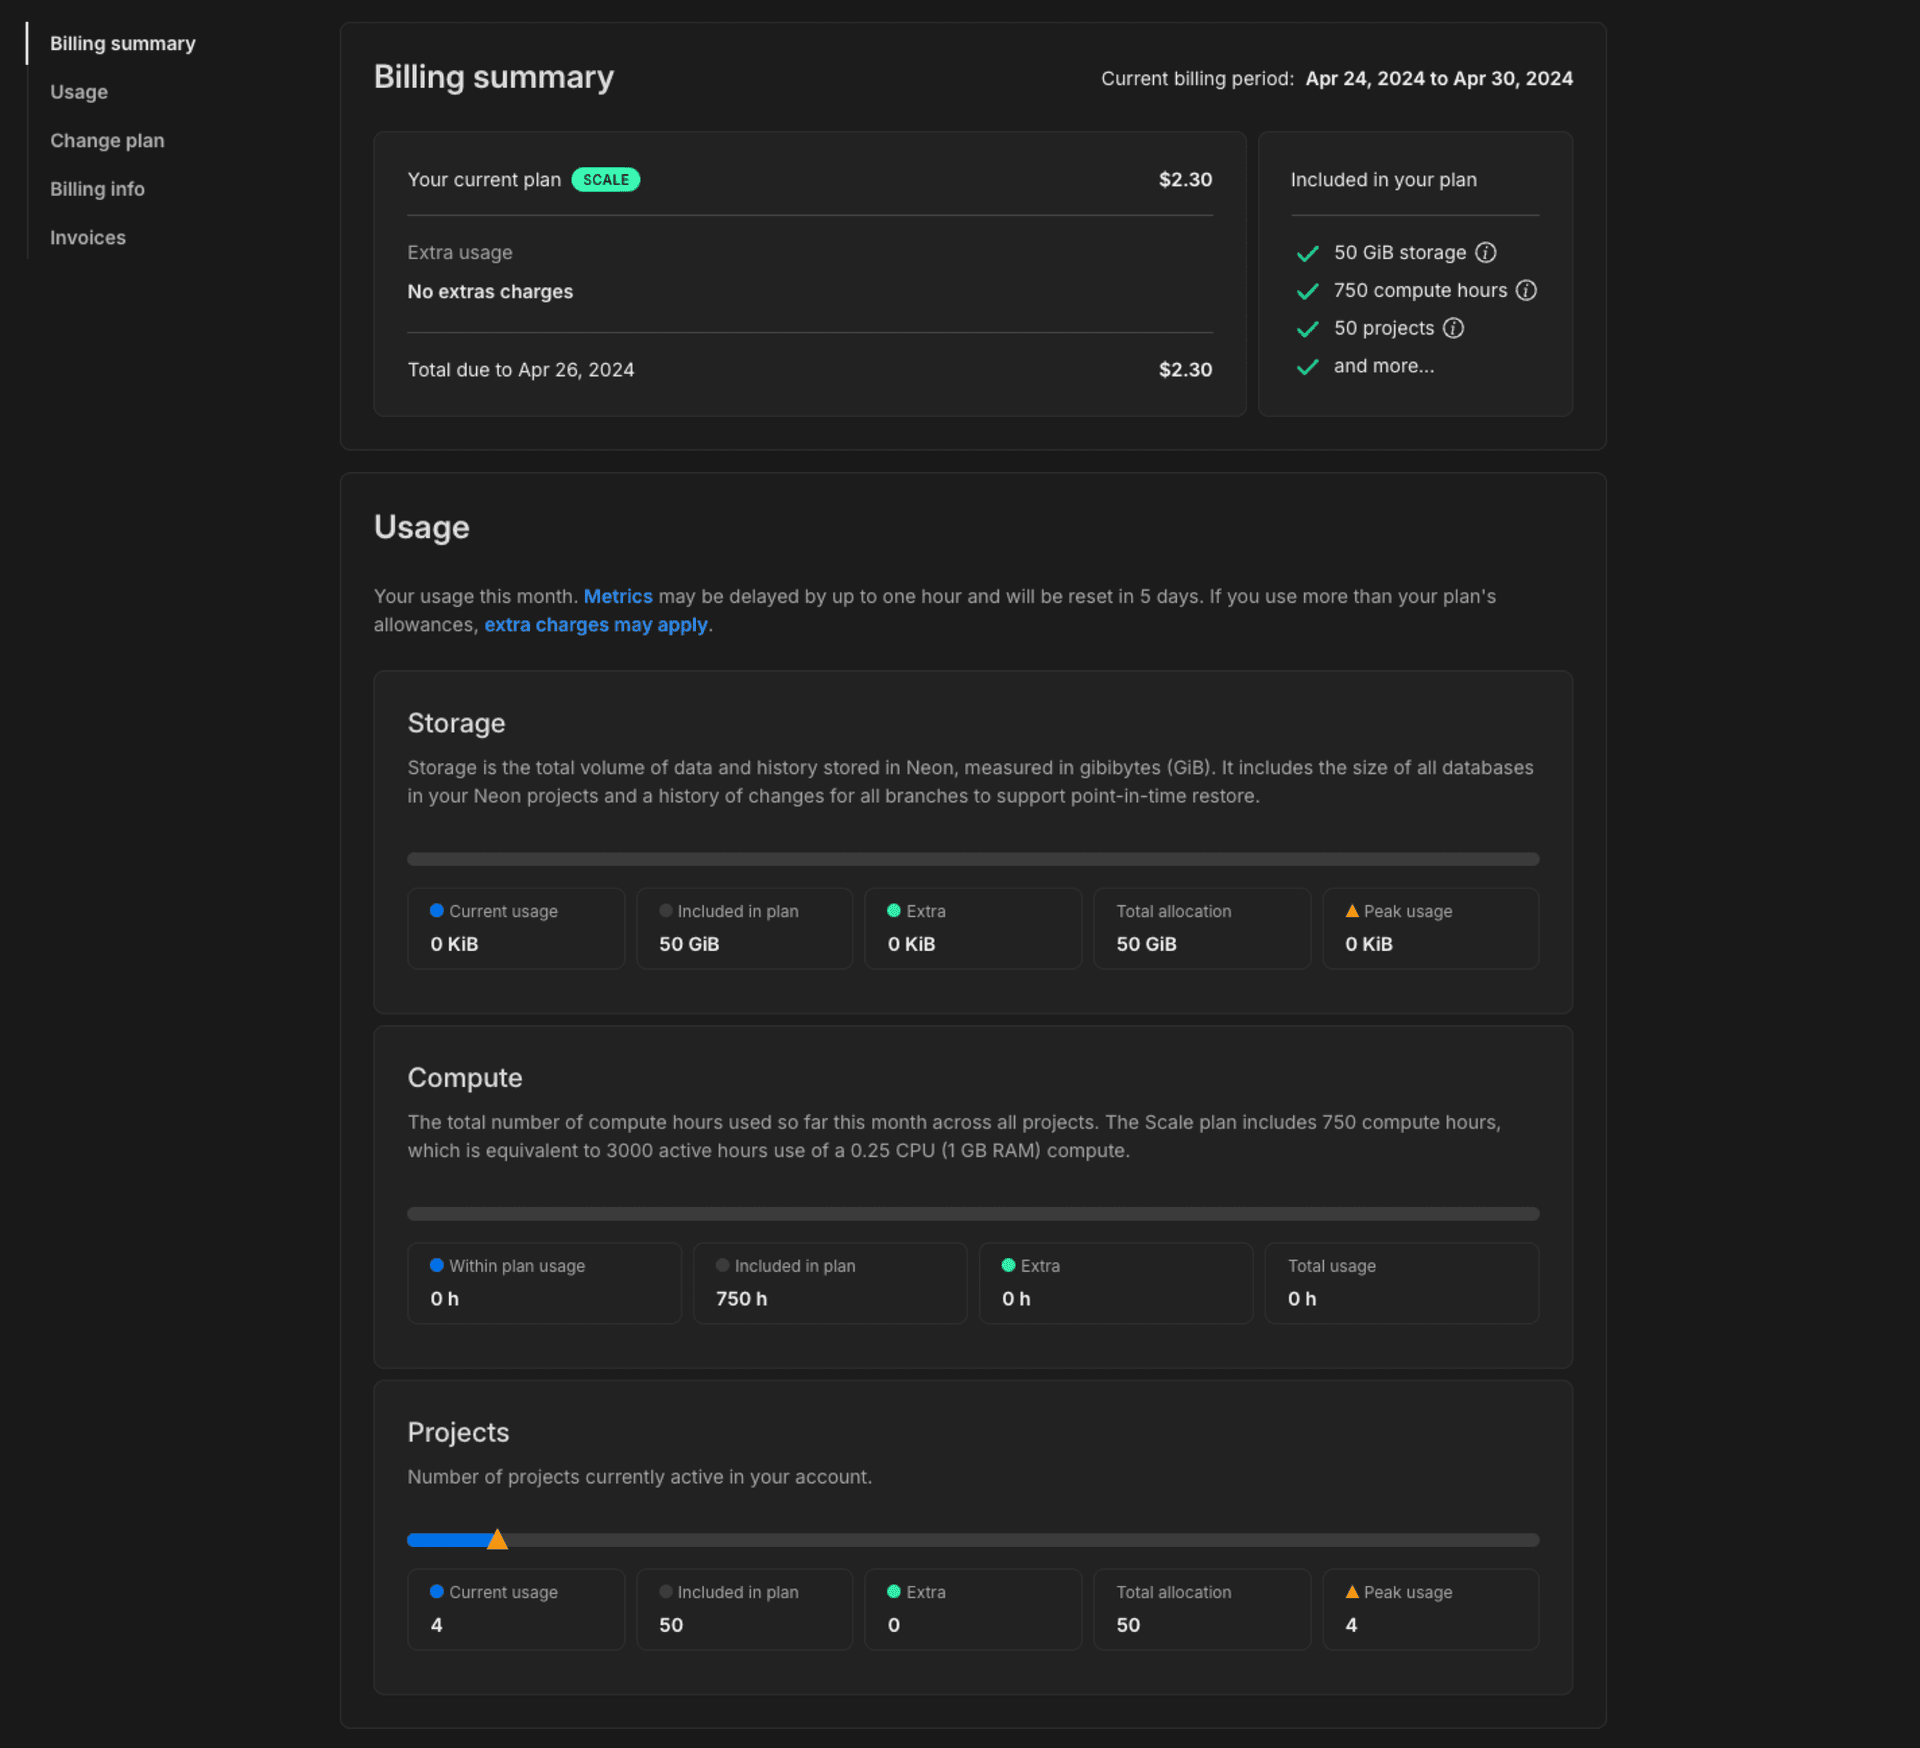
You can monitor billing and usage for all projects in your Neon account from the Billing page in the Neon Console.
- Navigate to the Neon Console.
- Select your Profile.
- Select Billing from the menu.
Here you will find the current bill and total usage for all projects in your Neon account.
Usage metrics on the Billing page include:
- Storage: Storage is the total volume of data and history stored in Neon, measured in gibibytes (GiB). Data is your logical data size. History is your data’s change history that is used to enable branching-related features, which you can configure for each project via the history retention setting. The displayed storage value reflects your current usage, including any extra storage that has been automatically added as a result of exceeding your plan's allowances.
- Compute: The total number of compute hours used during the current billing period. Compute usage is reset to zero at the beginning of each month. The monthly compute hour allowance differs by plan.
- Projects: Number of projects currently active in your account. The displayed value reflects your current usage, including any extra projects that have been automatically added as a result of exceeding your plan allowance.
- Branch compute: The total number of compute hours used by non-default branches during the current billing period. Compute usage is reset to zero at the beginning of each month. This metric only applies to the Free Plan.
- Data transfer The total volume of data transferred out of Neon (egress). Neon does not charge for egress data, but there is an allowance of 5 GB per month for Free Plan users. For all other plans, Neon maintains a reasonable usage policy. For more, see Data transfer. This metric only applies to the Free Plan.
On paid plan Billing pages, Peak usage is the highest usage level reached for storage or projects during the current billing period. When you exceed storage or project allowances, extra units are automatically allocated and billed based on the number of additional units needed to cover your excess usage, prorated from the date the excess was allocated.

Interpreting usage metrics
-
Compute usage is tracked in compute hours. A compute hour is 1 active hour for a compute with 1 vCPU. For a compute with .25 vCPU, it takes 4 active hours to use 1 compute hour. On the other hand, if your compute has 4 vCPUs, it takes only 15 minutes to use 1 compute hour.
note
On the Free Plan, you have 191.9 compute hours/month—enough to run a primary 0.25 CU compute 24/7. Up to 5 of those compute hours can be used for non-default branch computes. Autoscaling up to 2 vCPU with 8 GB RAM is available for extra performance during peak times, but please be aware that autoscaling can consume your compute hours more quickly, potentially impacting the ability to run a primary 0.25 CU compute 24/7. If you use Autoscaling or Read Replicas, you'll need to monitor your compute hours to ensure you don't run out before the end of the month.
-
Storage includes your data size and history. Neon maintains a history of changes to support branching-related features such as point-in-time restore. The Launch plan supports up to 7 days of history retention, the Scale plan allows up to 14 days, and the Business plan offers up to 30 days. The default is 1 day on all plans. Keep in mind that history retention increases storage. More history requires more storage. To manage the amount of history you retain, you can configure the history retention setting for your project. See Configure history retention.
-
What about extra usage?
The Launch plan supports extra storage and compute usage. The Scale and Business plans support extra storage, compute, and project usage. Any extra usage allowance is automatically added (and billed for) when you exceed the allowances included in your plan's base fee. If extra usage occurs, it is reflected in your monthly allowance on the Billing page. For example, if you purchased an extra 10 GiB of storage when you exceed your 50 GiB storage allowance on the Scale plan, the extra 10 GiB is added to your Storage allowance on the Billing page. Extra storage and projects reset at the beginning of the next month based on current usage. See Extra usage to learn more.
Project Dashboard
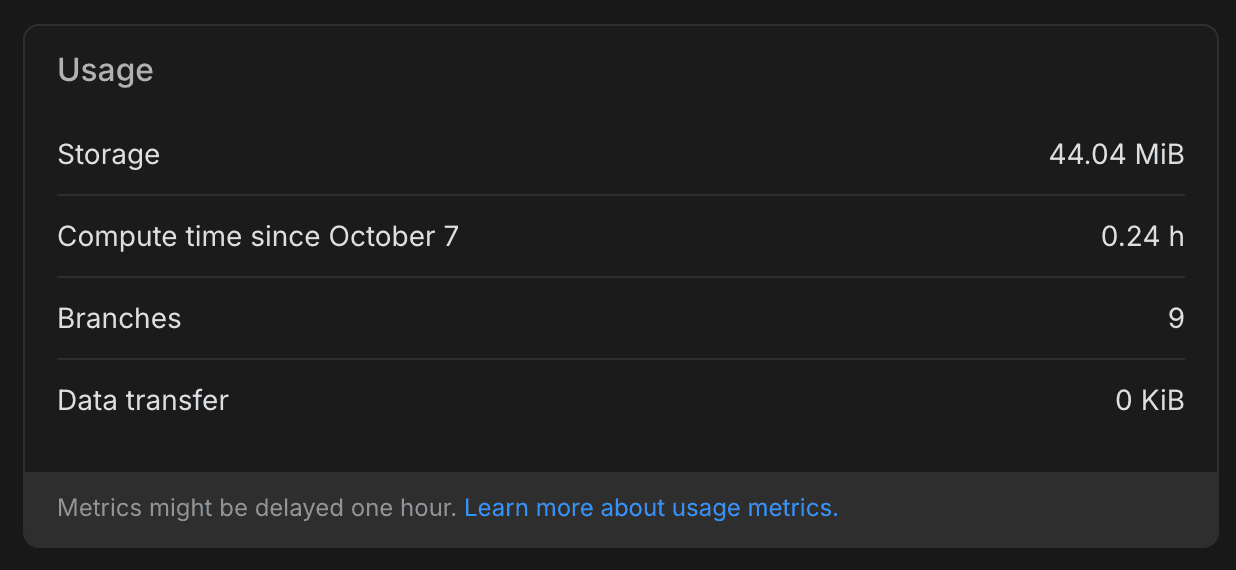
For paid plan users, the Usage widget on the Neon Dashboard shows a snapshot of project usage.

For Free Plan users, project usage is displayed across the top of the Project Dashboard.

For Free Plan users, the Projects page provides an Account Usage banner. This banner shows usage for all of your Neon projects for the current billing period.

Branches page
The Branches page in the Neon Console provides branch-specific metrics, including:
- Compute hours: The number of computer hours used by the branch's primary compute in the current billing period.
- Data size: The size of the data on the branch, not including history.
- Last active: The data and time the branch was last active.
To view the branches in your Neon project:
- In the Neon Console, select a project.
- Select Branches to view the branches for the project.
You can select a branch from the table to view additional details about the branch.
Retrieve usage metrics with the Neon API
Using the Neon API, you can retrieve a variety of usage metrics, which are highlighted in the Get branch details and Get project details examples below.
Get branch details
This example shows how to retrieve branch details using the Get branch details API method. Usage data is highlighted. Refer to the response body section of the Get branch details documentation for descriptions.
curl --request GET \
     --url https://console.neon.tech/api/v2/projects/summer-bush-30064139/branches/br-polished-flower-a5tq1sdv \
     --header 'accept: application/json' \
     --header 'authorization: Bearer $NEON_API_KEY' | jq
Response body
{
  "branch": {
    "id": "br-polished-flower-a5tq1sdv",
    "project_id": "summer-bush-30064139",
    "name": "main",
    "current_state": "ready",
    "logical_size": 427474944,
    "creation_source": "console",
    "default": true,
    "protected": false,
    "cpu_used_sec": 2505,
    "compute_time_seconds": 2505,
    "active_time_seconds": 9924,
    "written_data_bytes": 1566733560,
    "data_transfer_bytes": 40820887,
    "created_at": "2024-04-02T12:54:33Z",
    "updated_at": "2024-04-10T17:43:21Z"
  }
}
Get project details
This example shows how to retrieve project details using the Get project details API method. Usage data is highlighted. Refer to the response body section of the Get project details documentation for descriptions.
curl --request GET \
     --url https://console.neon.tech/api/v2/projects/summer-bush-30064139 \
     --header 'accept: application/json' \
     --header 'authorization: Bearer $NEON_API_KEY' |jq
Response body
{
  "project": {
    "data_storage_bytes_hour": 113808080168,
    "data_transfer_bytes": 40821459,
    "written_data_bytes": 1566830744,
    "compute_time_seconds": 2785,
    "active_time_seconds": 11024,
    "cpu_used_sec": 2785,
    "id": "summer-bush-30064139",
    "platform_id": "aws",
    "region_id": "aws-us-east-2",
    "name": "summer-bush-30064139",
    "provisioner": "k8s-neonvm",
    "default_endpoint_settings": {
      "autoscaling_limit_min_cu": 0.25,
      "autoscaling_limit_max_cu": 0.25,
      "suspend_timeout_seconds": 0
    },
    "settings": {
      "allowed_ips": {
        "ips": [],
        "protected_branches_only": false,
        "protected_branches_only": false
      },
      "enable_logical_replication": false
    },
    "pg_version": 16,
    "proxy_host": "us-east-2.aws.neon.tech",
    "branch_logical_size_limit": 204800,
    "branch_logical_size_limit_bytes": 214748364800,
    "store_passwords": true,
    "creation_source": "console",
    "history_retention_seconds": 86400,
    "created_at": "2024-04-02T12:54:33Z",
    "updated_at": "2024-04-10T17:26:07Z",
    "synthetic_storage_size": 492988552,
    "consumption_period_start": "2024-04-02T12:54:33Z",
    "consumption_period_end": "2024-05-01T00:00:00Z",
    "quota_reset_at": "2024-05-01T00:00:00Z",
    "owner_id": "8d5f604c-d04e-4795-baf7-e87909a5d959",
    "owner": {
      "email": "alex@domain.com",
      "branches_limit": -1,
      "subscription_type": "launch"
    },
    "compute_last_active_at": "2024-04-10T17:26:05Z"
  }
}
For related information, see Retrieving details about a project.